What isn't used at all?
Which features had zero documents in 12 months? Clear decommissioning candidates — and a case for a smaller cloud scope.
Feature Insights links usage and org data to your Feature Map. It reveals which functions are used how heavily per org unit and over time — the factual basis for license, scope and decommissioning decisions.
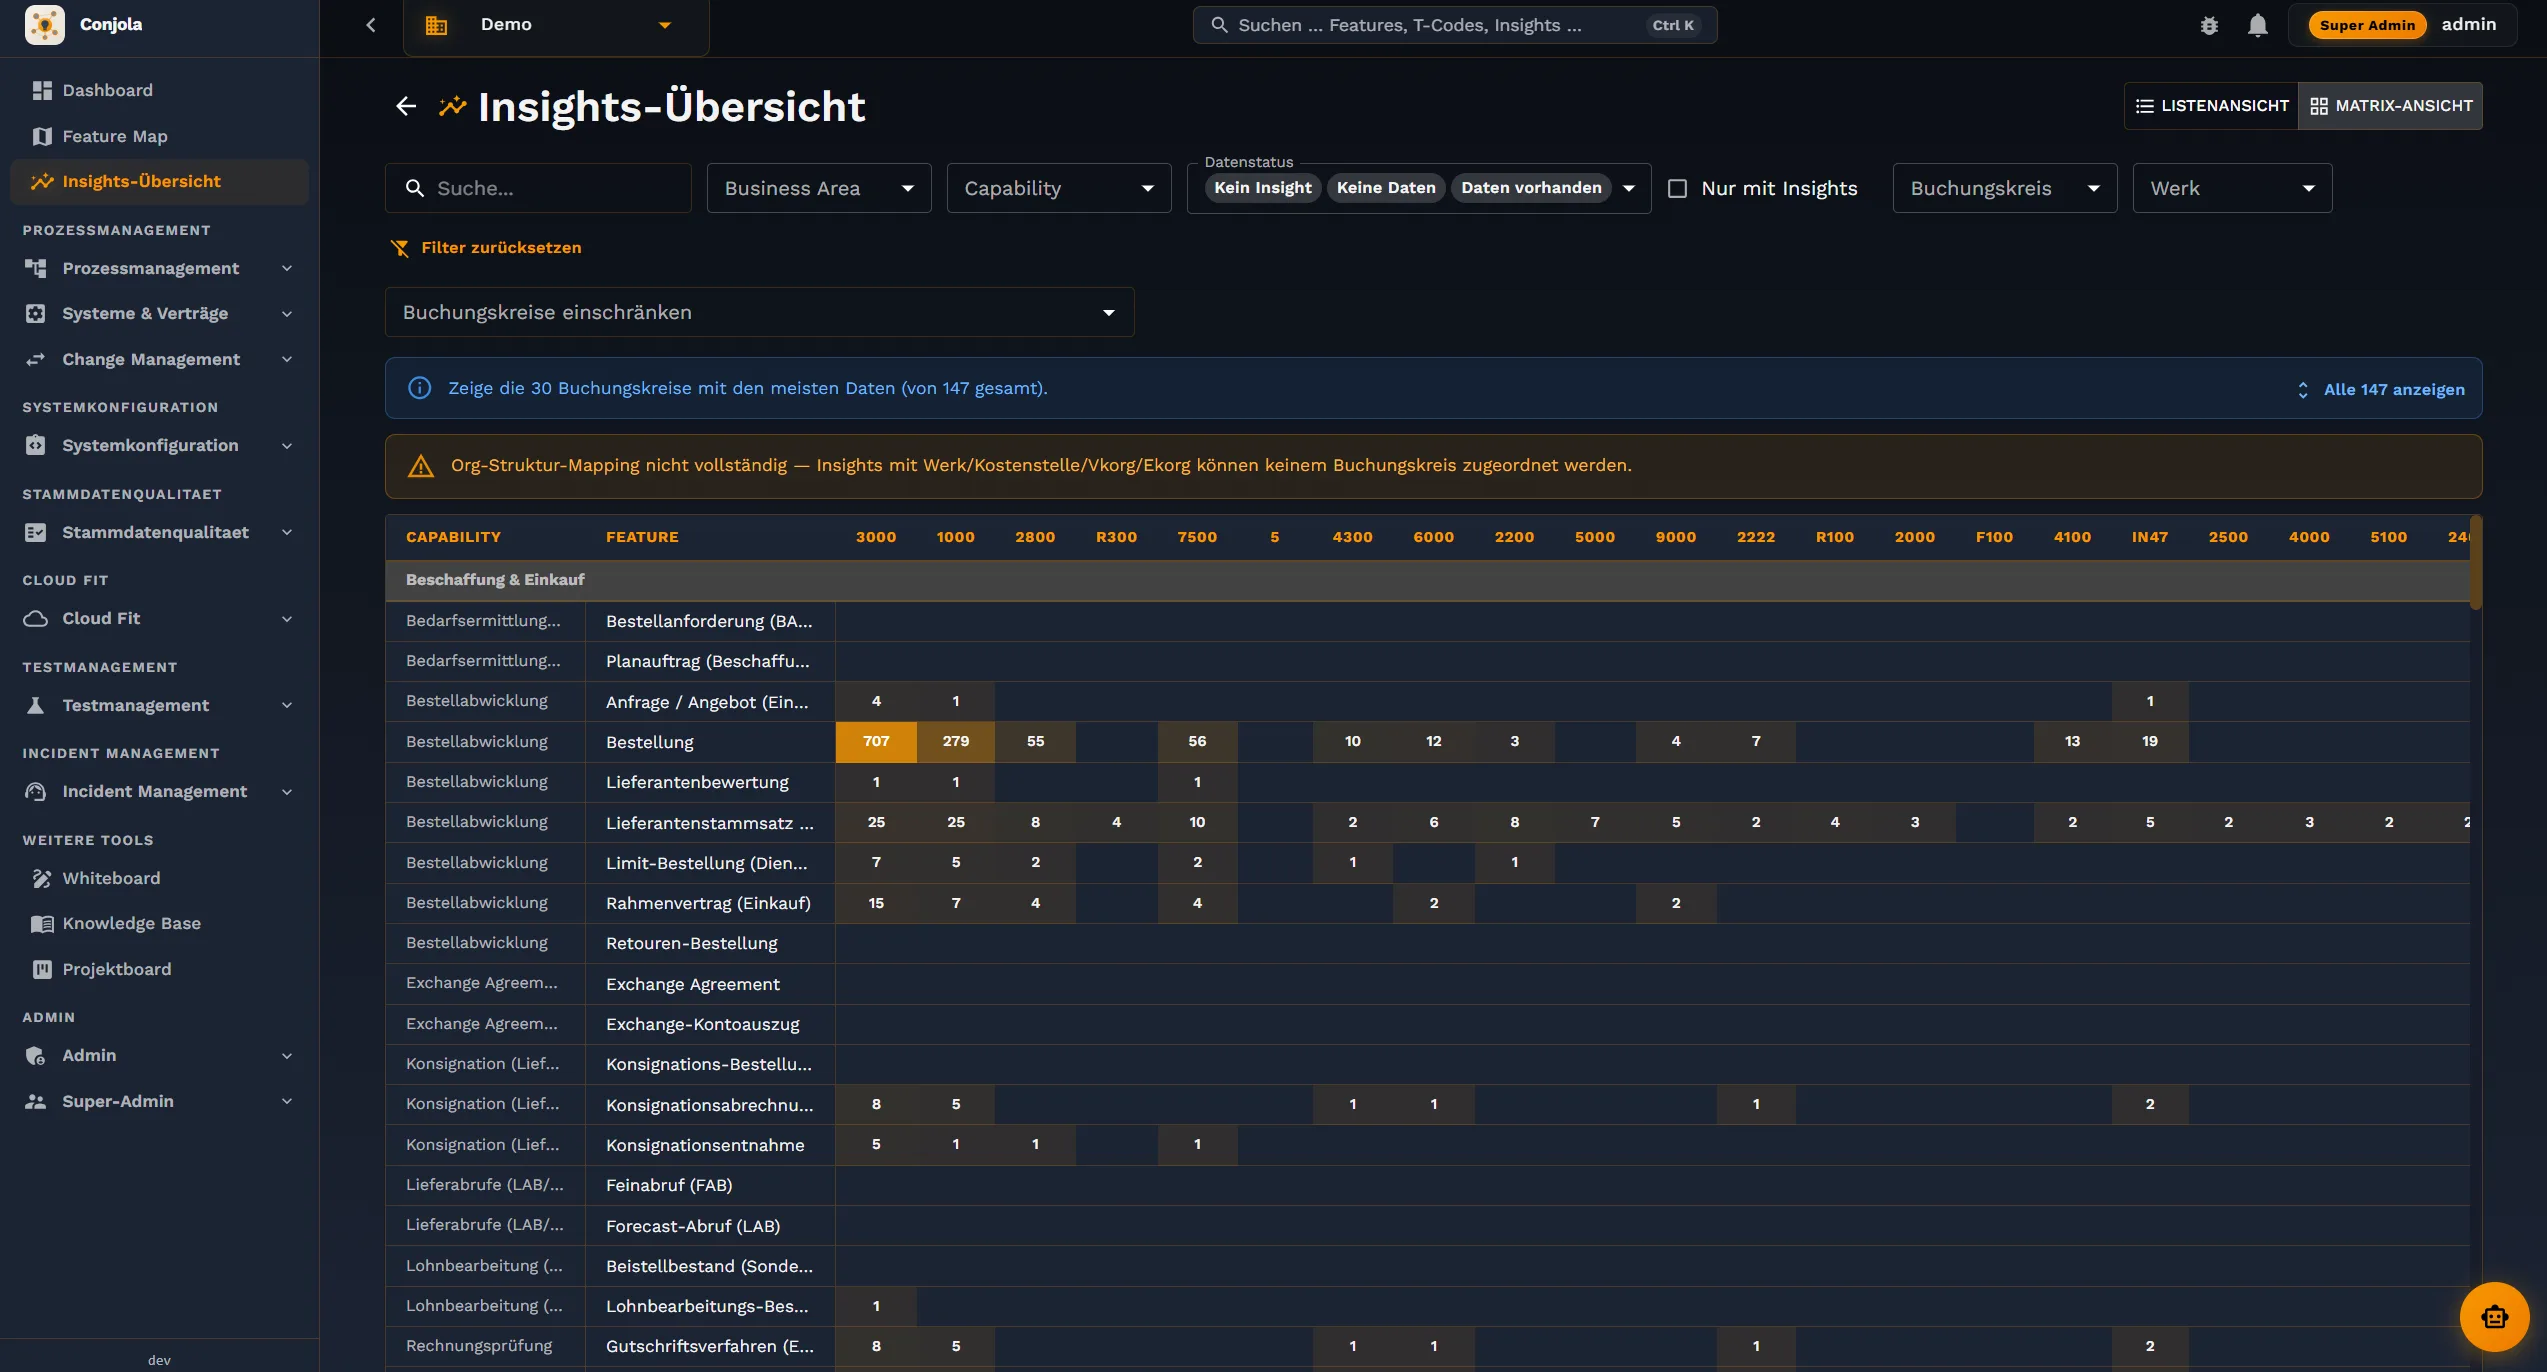
Which features had zero documents in 12 months? Clear decommissioning candidates — and a case for a smaller cloud scope.
Which 20 features carry 80 % of the volume? This is where optimization pays off and migration needs extra care.
Which org units use a feature exclusively? Crucial before someone switches off something a plant still relies on.
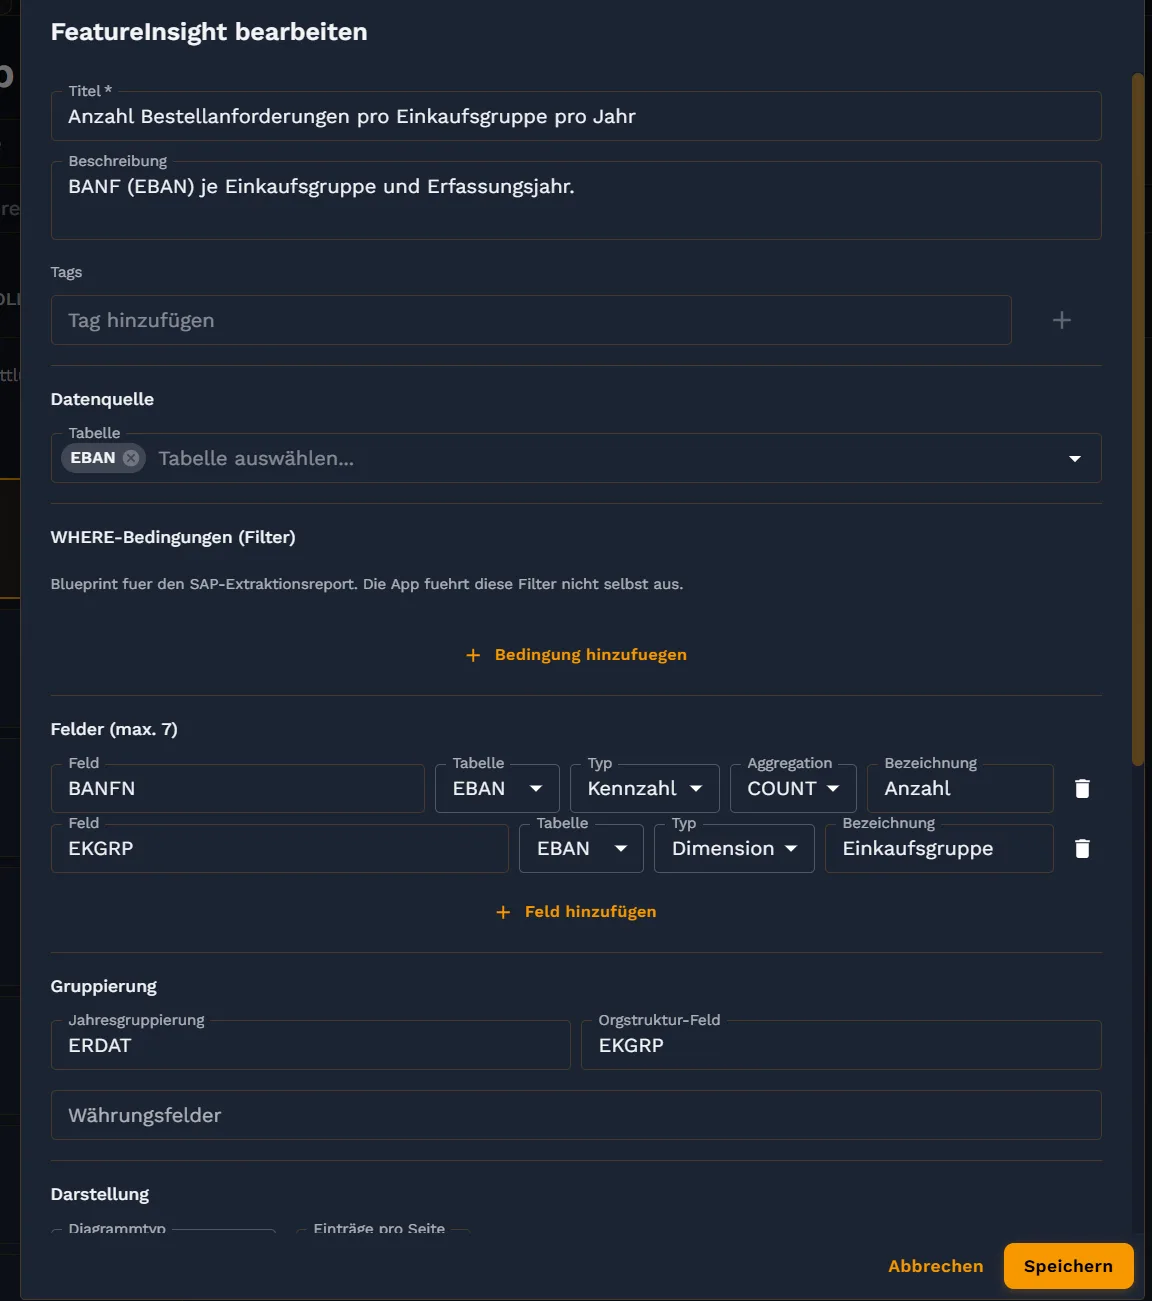
Three axes along which usage can be broken down.
Document volume, number of users and last activity per feature — from workhorse to dead weight.
Usage per company code, plant or sales area — shows where a function lives and where it doesn't.
Trend across months and quarters — is usage growing, stagnating or fading out?
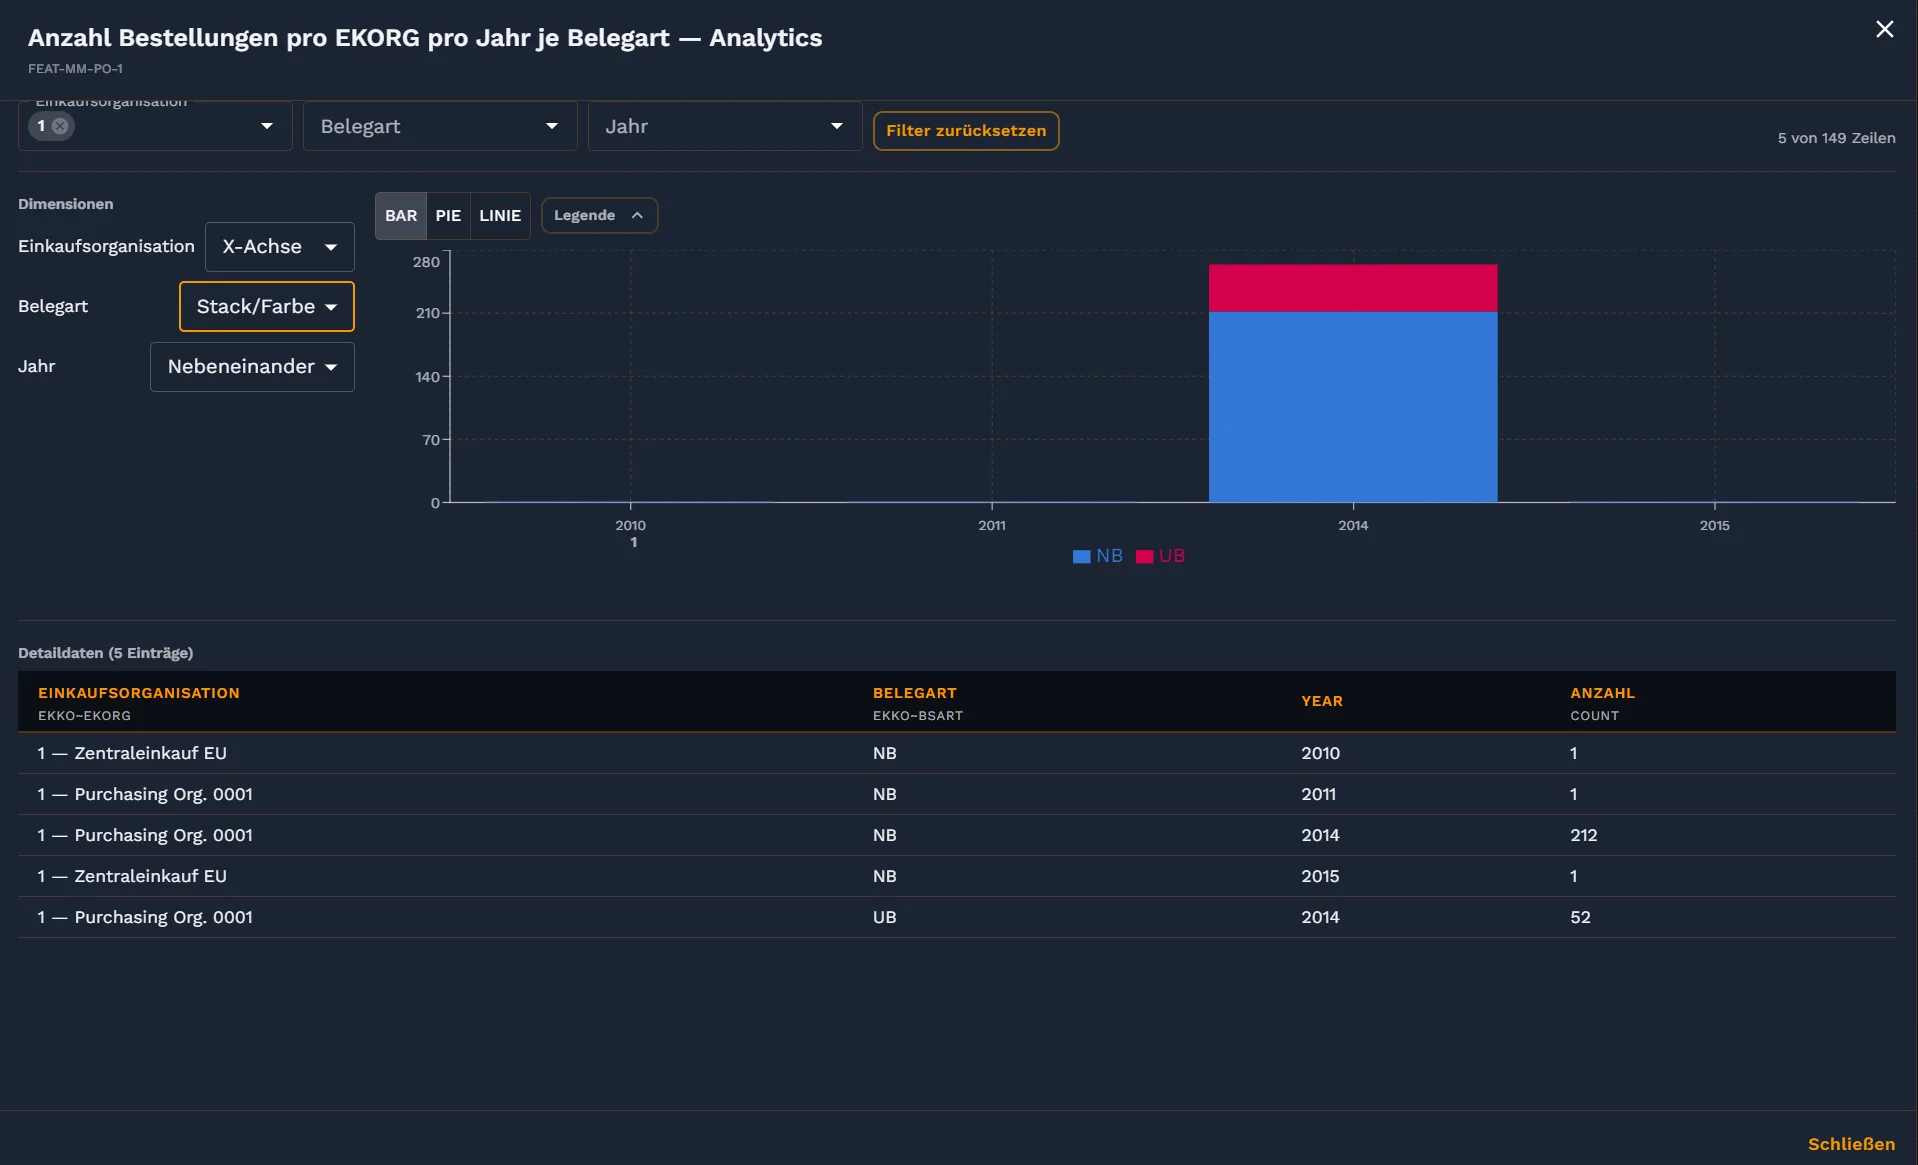
Usage data becomes a basis for decisions.
Are you paying for functionality nobody uses? Insights sharpens your license model and cloud scope down to what's actually needed.
Unused features and dead custom developments become evidenced — safely retirable, because no org unit depends on them anymore.
In a short demo we'll show you how Conjola turns your document data into a basis for decisions.
Book a demo