Variants & frequencies
How many paths actually run through your P2P process? Discovery shows e.g. 47 variants — and that 6 of them cover 80 % of all cases.
Process Discovery reconstructs real end-to-end process chains straight from your SAP document flows. Not the intended target model, but actual behavior — with its variants, loops and deviations.
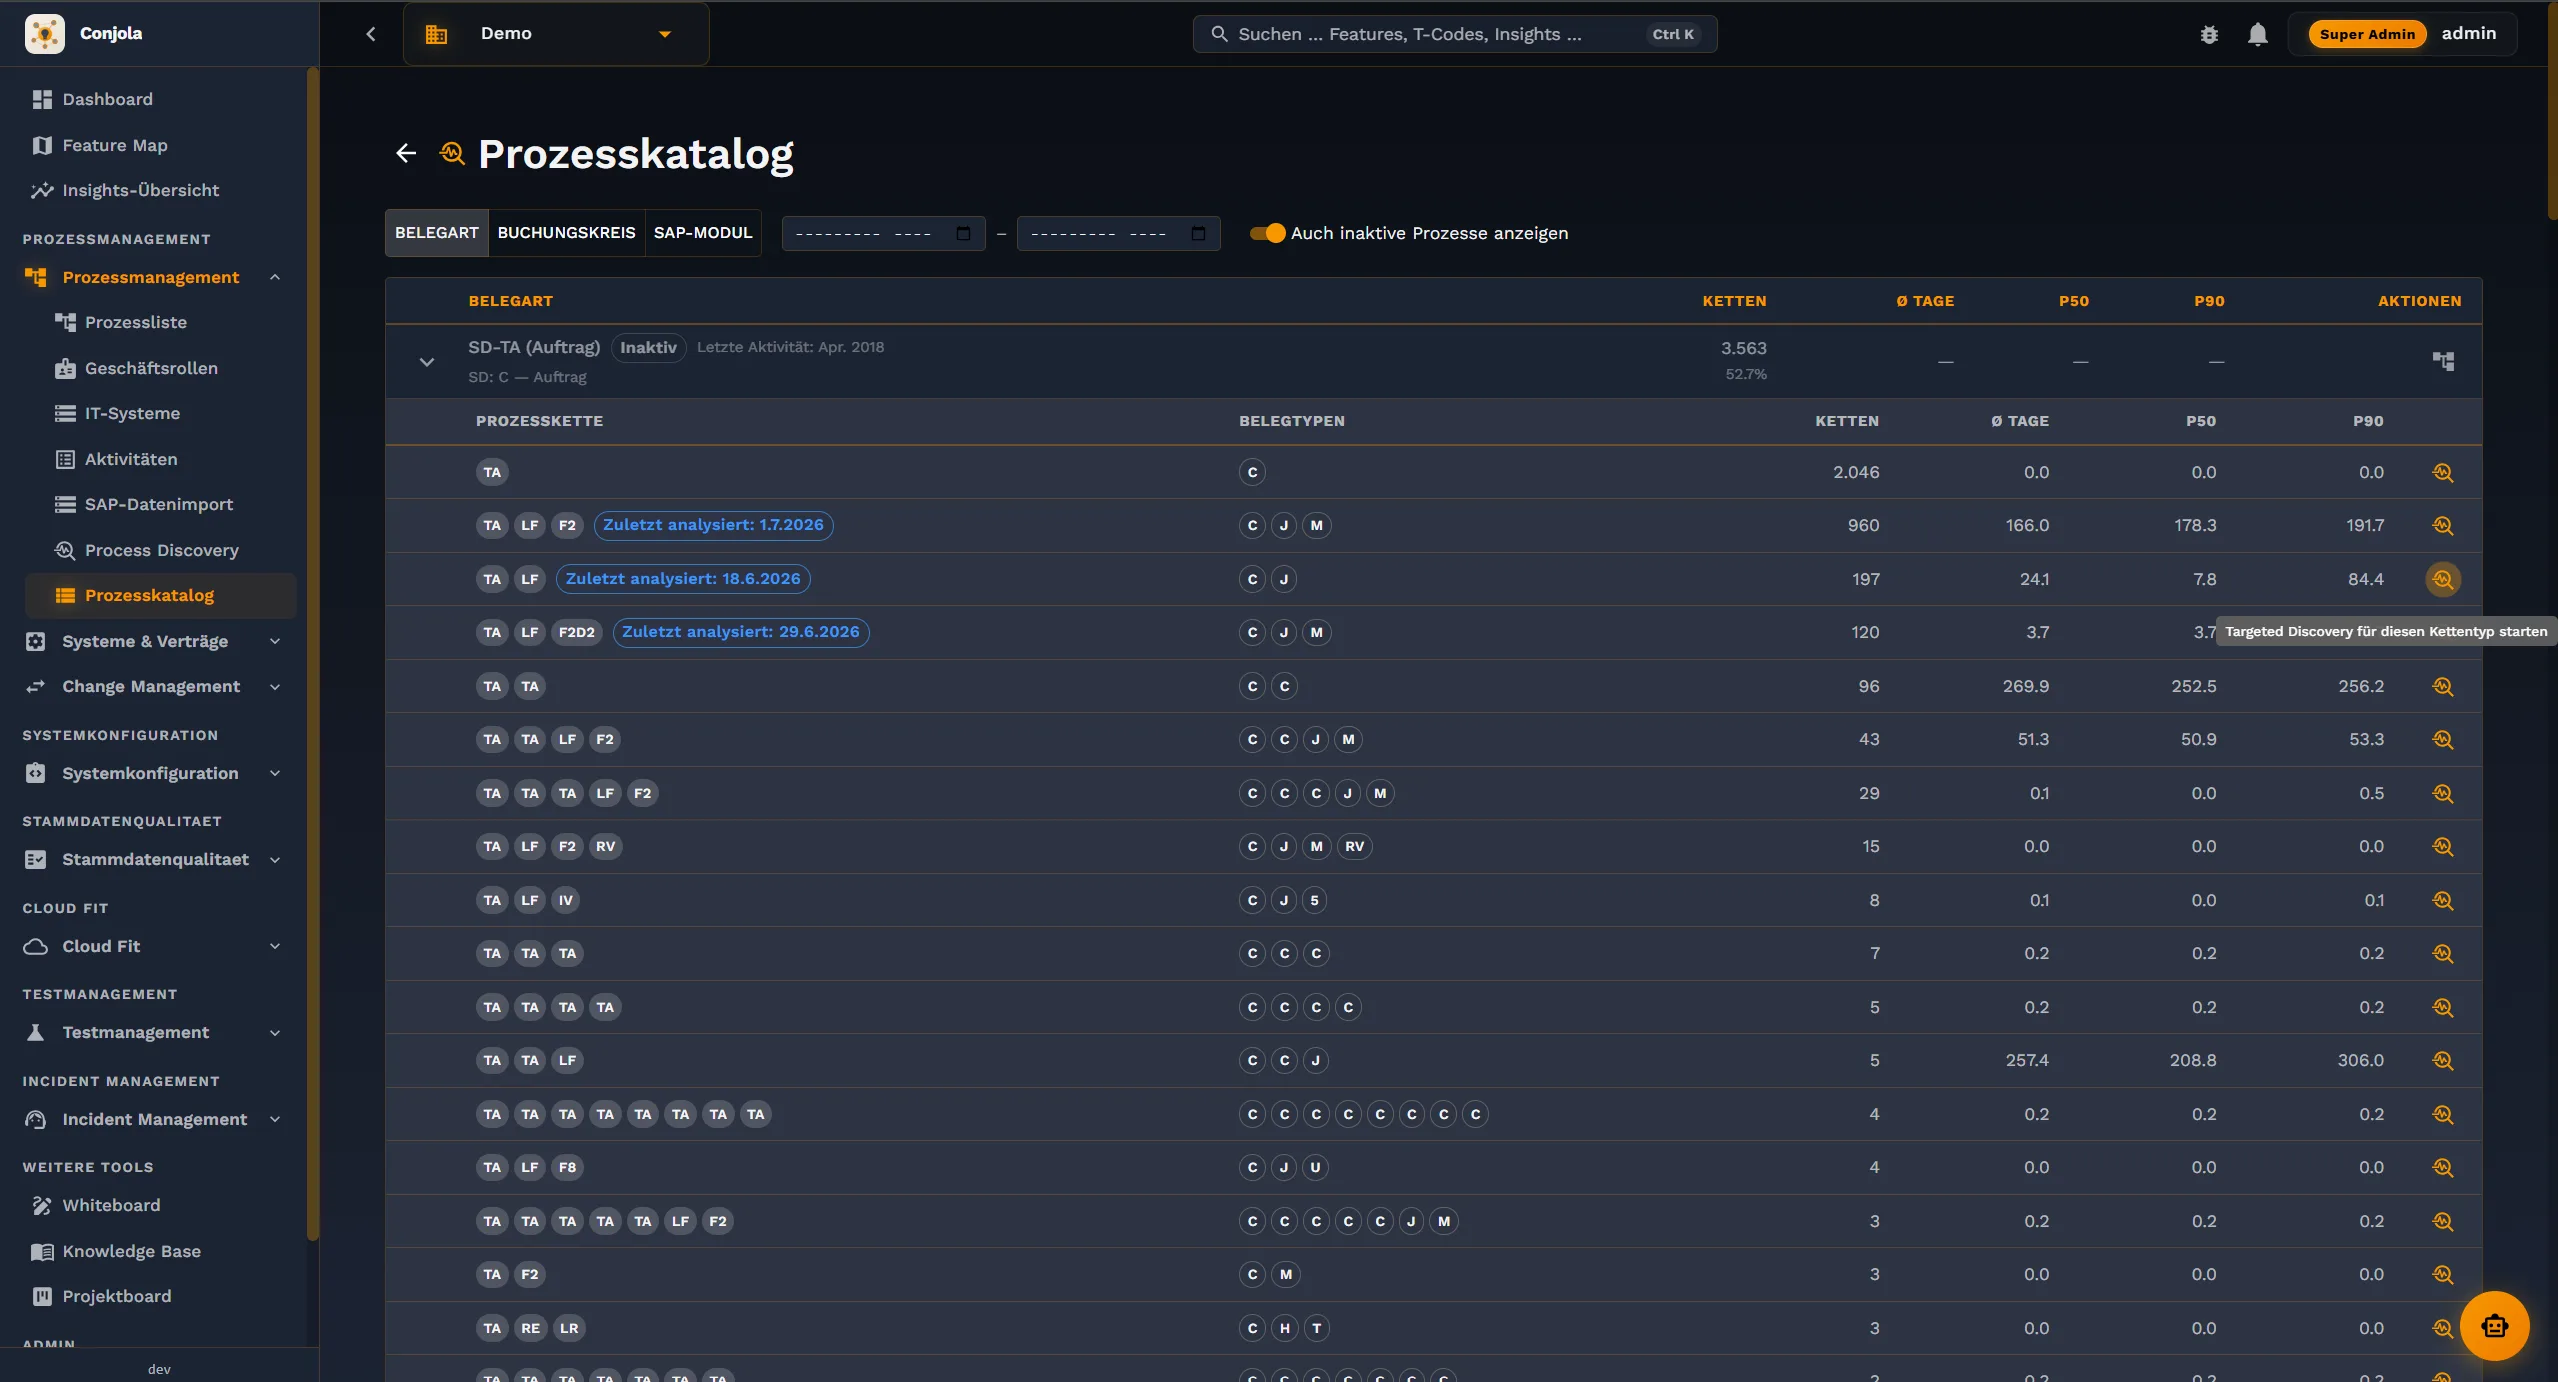
How many paths actually run through your P2P process? Discovery shows e.g. 47 variants — and that 6 of them cover 80 % of all cases.
What share runs without manual intervention? How often does someone step in to correct, e.g. with a subsequent posting adjustment?
Where do idle times build up? Discovery measures the time between goods receipt and invoice posting — per variant, per plant.
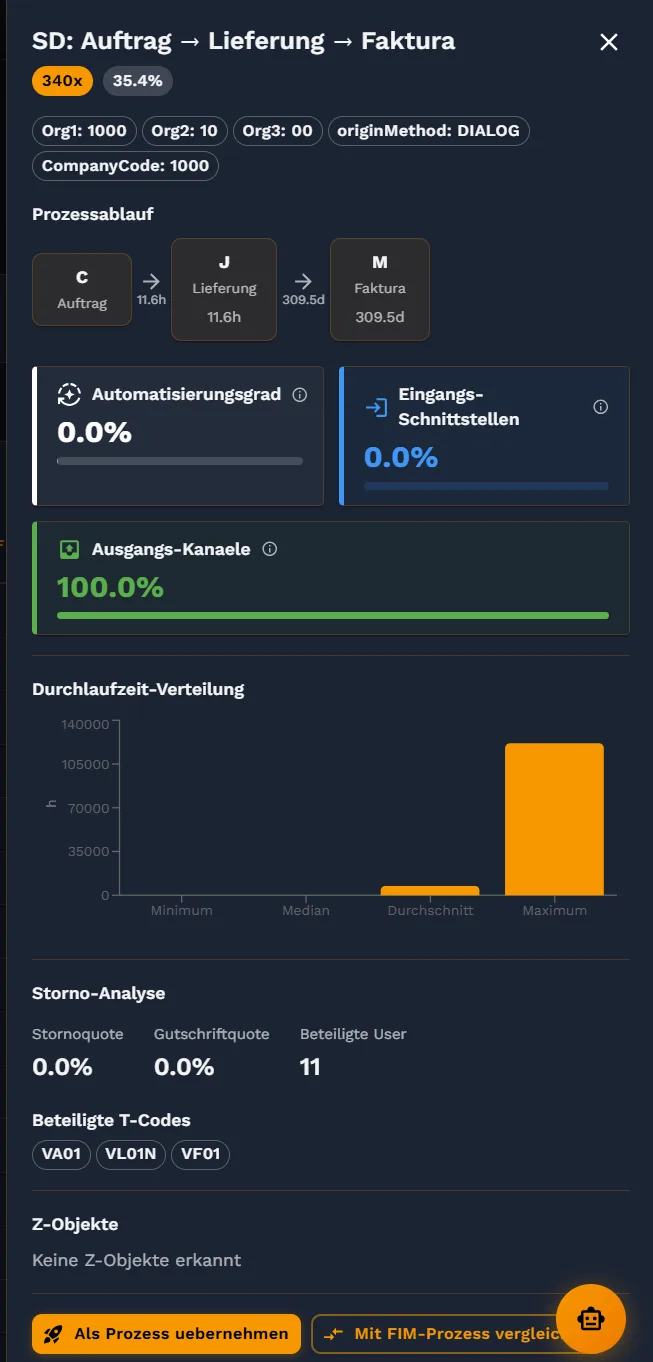
Conjola recognizes standard chains from document types and their links.
Purchase order → goods receipt → invoice verification → payment. Including partial deliveries, price variances and blocking indicators.
Sales order → delivery → billing → incoming payment. With cancellations, returns and credit memos as visible variants.
Posting → accrual → close → reporting. Period-end work and manual adjustment postings become transparent.
Whether SAP standard transaction or Z-program — the drilldown leads into both alike and shows what technically carries the step.
Usage, frequencies and relationships are presented graphically — instead of raw tables you get an understandable picture.
Process, function and usage stay linked. No jumping between tools, no losing the thread.
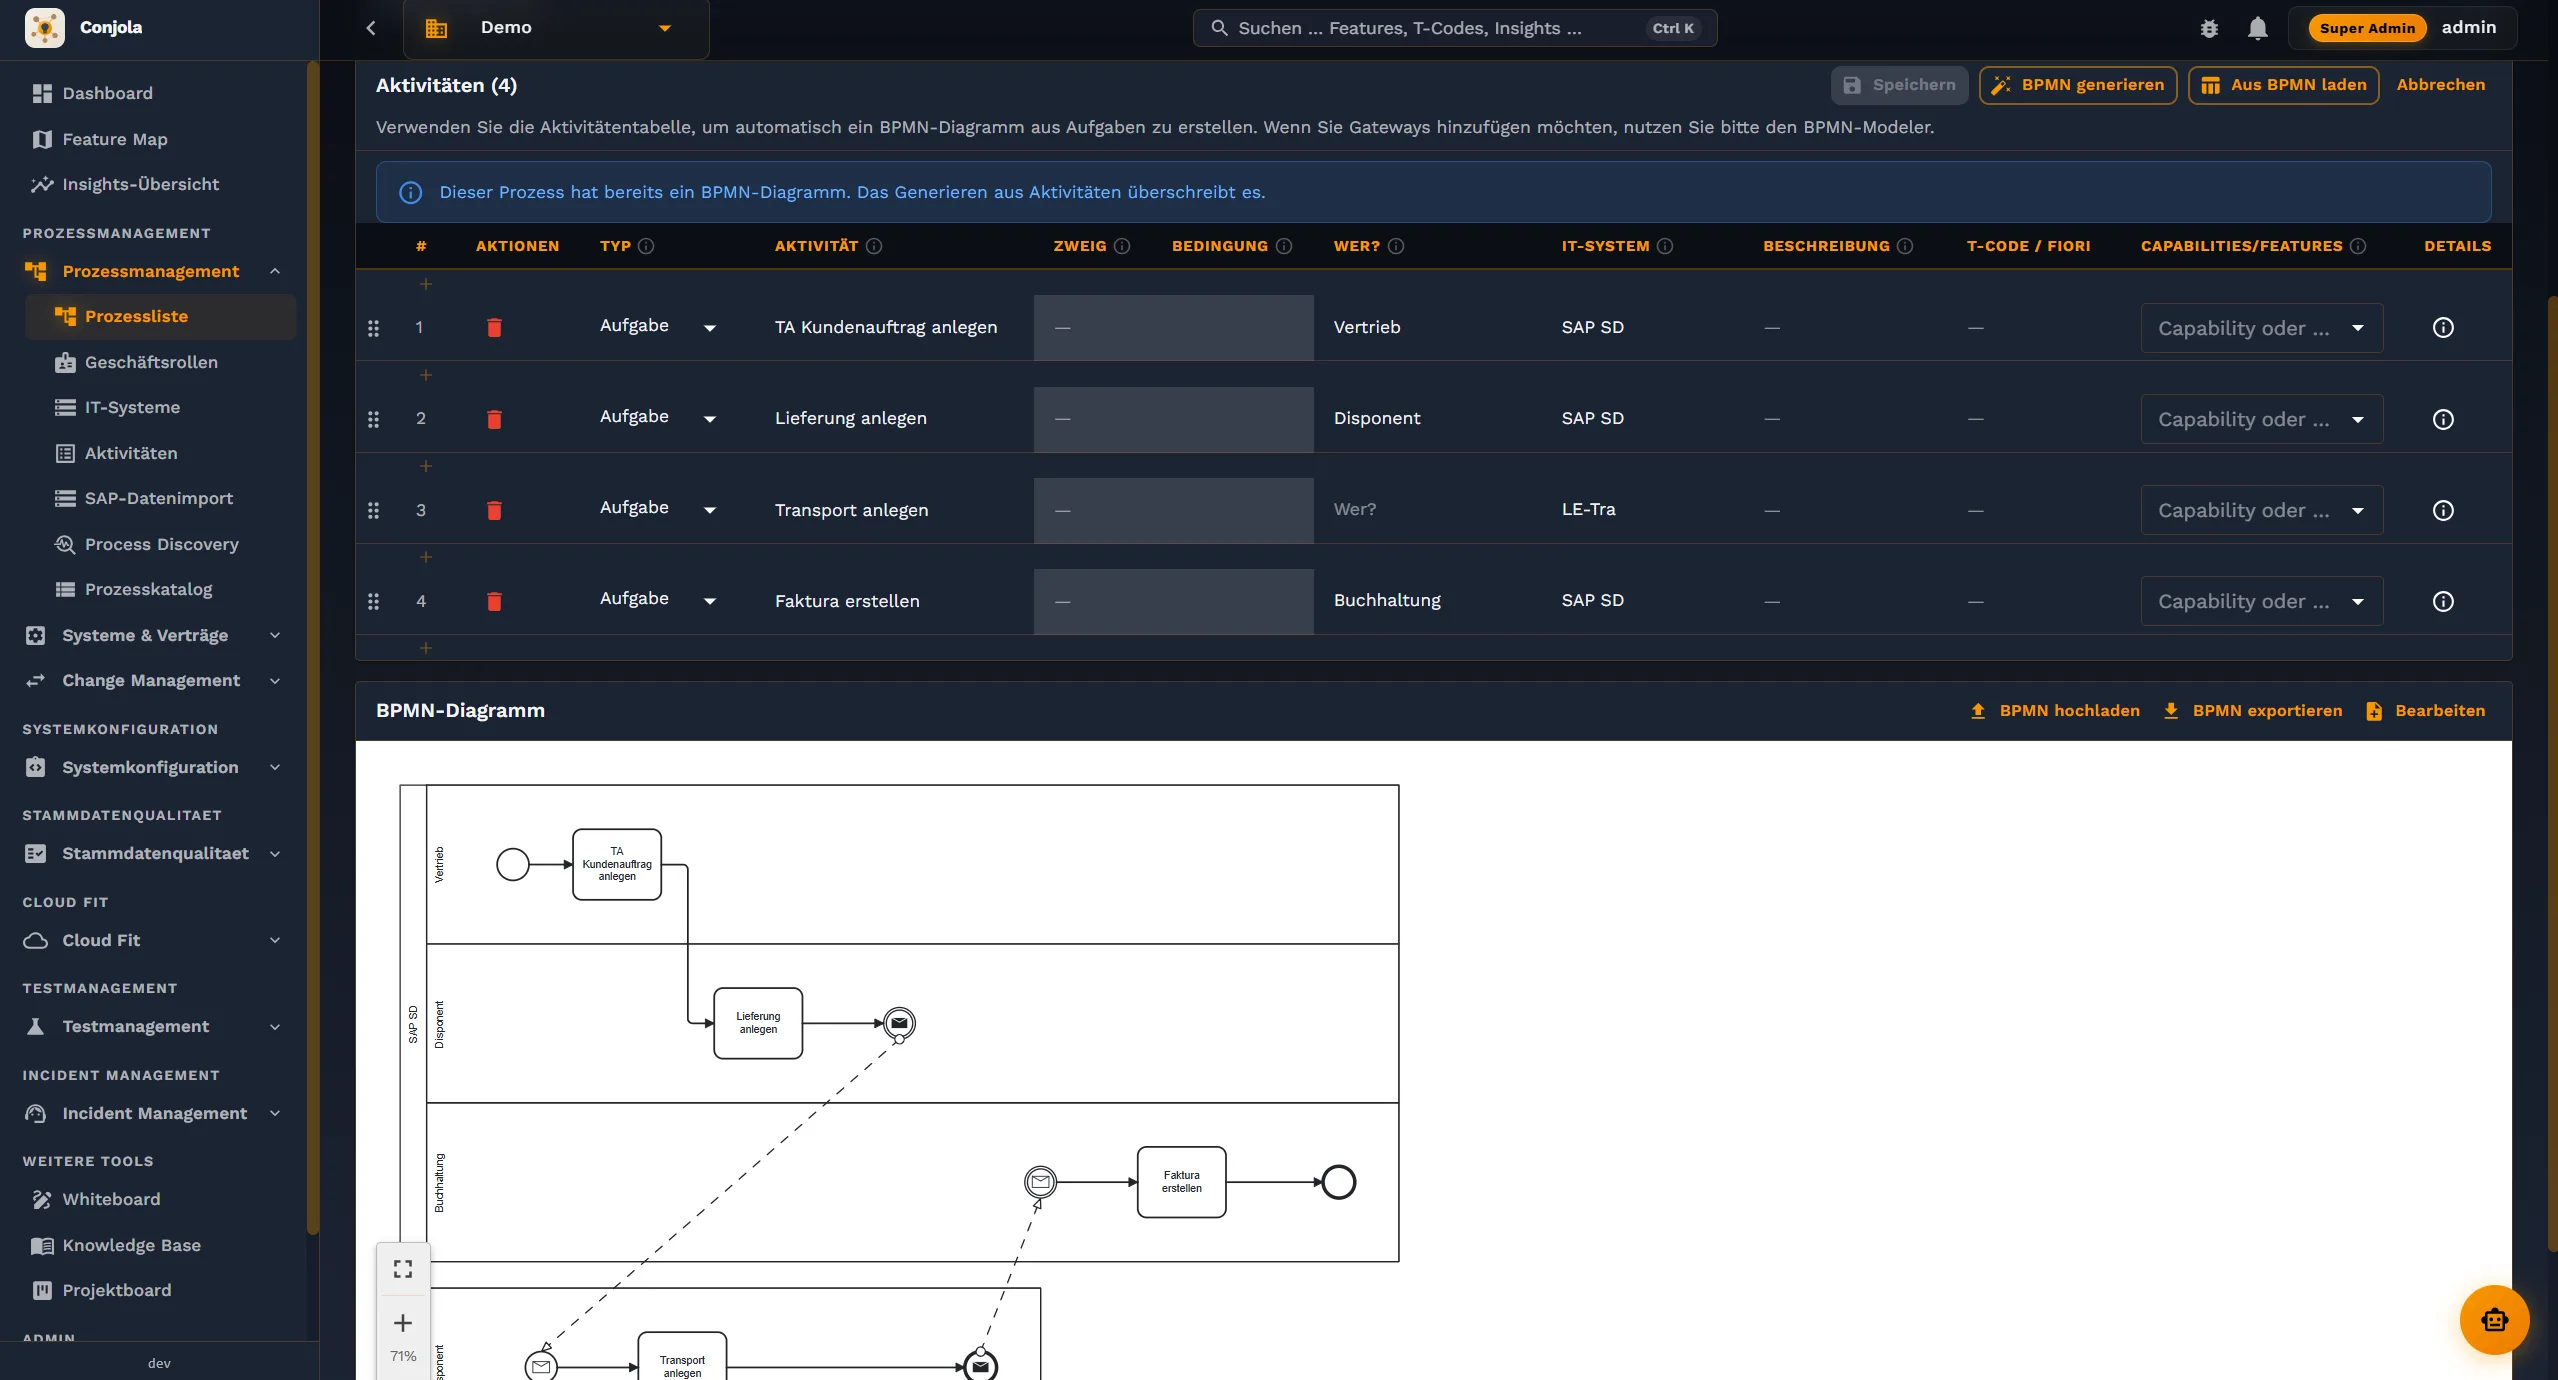
Modelled processes show how it is meant to be. Document data shows how it is.
The analysis is built on your real documents — no interview, no assumption. Even rare variants that trip up a project later come to light.
No polished target flows. The data speaks for itself — a basis for fact-based decisions instead of debate.
In a short demo we'll show you how Conjola turns your document data into a basis for decisions.
Book a demo